

Cryptocurrency charts can be a valuable tool for traders and investors to gain insights into the market and make informed decisions about their investments. In this article, we provide a beginner’s guide to cryptocurrency charts and explain some of the key features and metrics in a chart.
What’s in a crypto chart?
Cryptocurrency charts are graphical representations of the price movements of a particular cryptocurrency over a specified period of time. They typically show the opening, closing, high, and low prices for each time period, along with the trading volume. This information helps investors and traders identify trends and patterns in the market, as well as make predictions about where prices are headed.
One of the key metrics that cryptocurrency charts can provide is trading volume. This refers to the total number of units of a cryptocurrency that have been traded over a given period of time. High trading volumes can indicate strong interest in a particular cryptocurrency and may suggest that the price is likely to rise. Low trading volumes, on the other hand, may indicate a lack of interest in the cryptocurrency and could signal a potential price drop.
Another important metric that cryptocurrency charts can provide is market capitalization. This refers to the total value of all the units of a cryptocurrency in circulation. A high market capitalization can indicate that a cryptocurrency is well-established and widely adopted, while a low market capitalization may suggest that it is a lesser-known or less widely used cryptocurrency.
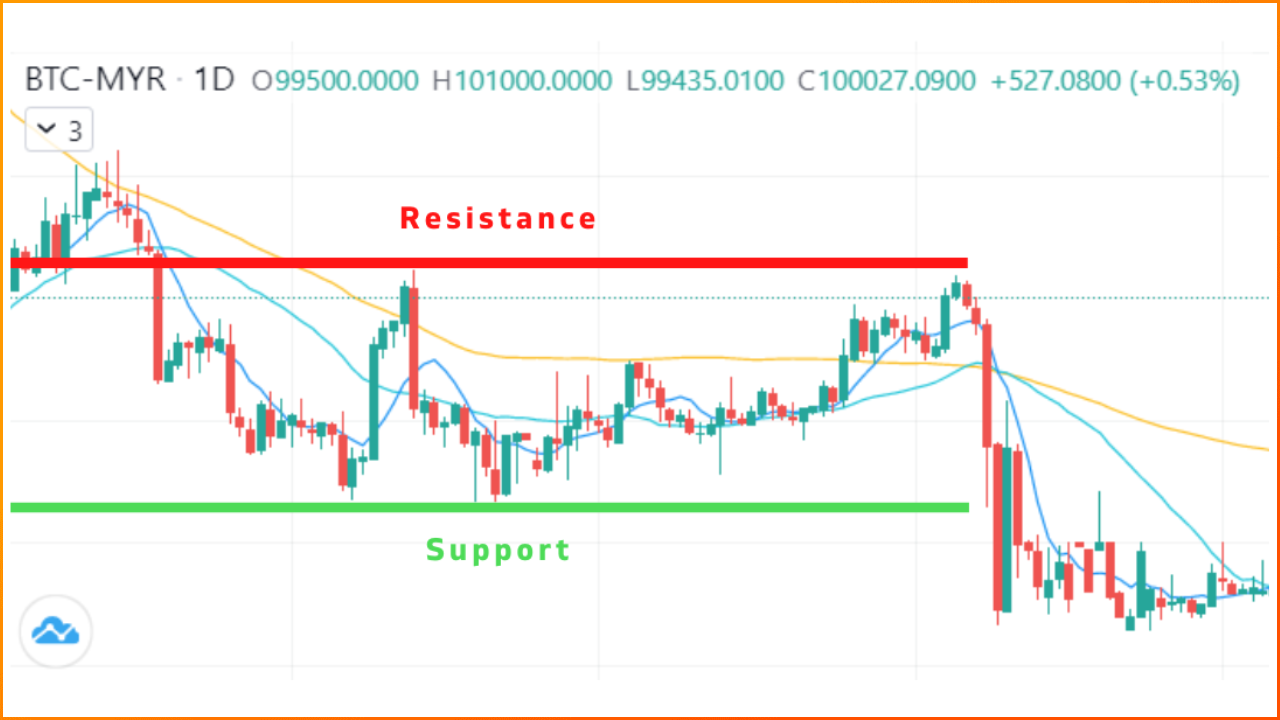
Cryptocurrency charts can also provide other useful information, such as the support and resistance levels. Identifying these levels can help traders and investors determine when to enter and exit the market. Here is how you can easily make use of this in your own trading:
Support Levels – Price points at which the demand for a particular cryptocurrency is strong enough to prevent its price from falling any further. These levels are formed when a large number of buyers enter the market and buy the cryptocurrency. When the price of a cryptocurrency reaches a support level, it is expected to bounce back and start moving higher. If the support level holds, it may be a good time to consider buying the crypto as it may continue to rise.
Resistance Levels – Price points at which the demand for a cryptocurrency has been pushed back down. These levels are formed when a large number of sellers enter the market and sell the cryptocurrency. When the price of a cryptocurrency reaches a resistance level, it is expected to fall back and start moving lower. If the resistance level is not broken through, it may be a good time to consider selling the cryptocurrency as it may continue to decline.
*It’s important to keep in mind that support and resistance levels can change as market conditions change. It’s always a good idea to keep an eye on the price action of a cryptocurrency and be prepared to make a move if the support or resistance level is broken.
Cryptocurrency charts are an essential tool for anyone looking to trade or invest in the crypto market. They provide valuable insights into market trends, trading volumes, market capitalizations, and support and resistance levels, which can help investors and traders make informed decisions about their investments. To know more, head over to Tokenize Malaysia’s ‘Markets’ page for information and start trading now!